
Eating in a deficit and not losing weight has two explanations, both measured. Over two weeks, normal scale noise in adults eating at maintenance was 1.2 kg either way, more than a true 500 kcal deficit removes in that time. And in the one study that checked, people sure of their deficit under reported intake by 47 percent.
Listen to this article, about 13 minutes. A synthetic voice reads the article and announces each section title as it begins; tables are read row by row and the questions at the end are left out.
Recorded 12 October 2026 from the article as published that day. Press a chapter to jump there; the highlighted line is what is playing. A play button sits beside every section heading, and once you scroll past this player a bar at the bottom of the screen keeps the controls in reach. Tap or click any sentence to hear the reading start from there.
On this page: the 1.2 kg normal two week swing from Bhutani 2017 set against what a true 500 kcal deficit removes by day 14, 28, 42 and 56, the 47 percent diary gap Lichtman 1992 measured, and four dated r/loseit threads read for what people actually report.
Think you already know this? Five questions, one minute.
Every answer is on this page. Answer from what you know now; the page fills in the rest.
-
1. In the Bhutani 2017 cohort, what was the standard deviation of the two week change in body weight among adults in energy balance?
Bhutani, Schoeller and colleagues reported an average two week change of 0.26 kg with a standard deviation of 1.2 kg, which is the normal noise a real deficit has to show through. Read the section
-
2. By how much did the diet resistant group in the 1992 New England Journal of Medicine study under report their food intake?
Lichtman and colleagues measured ten people for two weeks and found intake under reported by 47 percent and activity over reported by 51 percent, with normal energy expenditure. Read the section
-
3. Under the Hall rule of thumb, roughly how long does it take to reach half of the eventual weight change from a sustained change in intake?
Hall and colleagues put half of the change at about one year and 95 percent at about three, which is why a 500 kcal deficit removes well under a kilogram of fat in its first fortnight. Read the section
-
4. Across the four r/loseit threads read for this page, how long had every poster been tracking when they posted?
All four posters, from the May 2026 thread to the October one, had tracked for a month or less, which is inside the span where the expected loss sits within normal noise. This is what people reported, not a measurement. Read the section
-
5. In the Orsama 2014 study of 4,657 daily weights from 80 adults, on which days did weight peak?
Orsama and colleagues found weight highest on Sunday and Monday and falling through the week, and concluded that weekend rises should be read as normal rather than as gain. Read the section
Why can a real deficit vanish on the scale for weeks?
Start with the uncomfortable number, because it is the one the ranking pages skip. In 2017, Bhutani, Schoeller and colleagues weighed two groups of adults two weeks apart while they lived as normal. The average change was 0.26 kg, consistent with energy balance, but the spread around it was a standard deviation of 1.2 kg. In plain terms: a person doing nothing different can be 1.2 kg heavier or lighter a fortnight later, and about one in three will swing further than that. The scale is not lying. It is just measuring water, glycogen, salt and the contents of your gut alongside the fat you care about.
Now put that beside what a deficit can actually remove. The old rule says 3,500 kcal per pound, so 500 kcal a day is a pound a week. Hall and colleagues showed in the Lancet in 2011 that this rule drastically overestimates weight change, because the body spends less as it gets lighter, and they replaced it with a rule of thumb: every 10 kcal a day of sustained change moves eventual weight by about one pound, half of it in about a year and 95 percent in about three. That model is what the NIDDK Body Weight Planner runs. Under either rule, a 500 kcal deficit has removed well under a kilogram of fat at two weeks. The noise is bigger than the signal, and nobody told you that when you downloaded the app.
This is the part the fat burner adverts rely on, incidentally. A two week promise is a promise about something the scale cannot resolve in two weeks. The calorie deficit explainer covers why the inputs are estimates to begin with.
How often is the deficit real at all?
The second explanation is older and less flattering, and it comes from the New England Journal of Medicine. In 1992, Lichtman and colleagues took ten people who reported eating under 1,200 kcal a day without losing weight and measured them for two weeks with doubly labelled water and indirect calorimetry. The group under reported food intake by an average of 47 percent, with a standard deviation of 16, and over reported physical activity by 51 percent, with a standard deviation of 75. Their measured energy expenditure was normal. The authors concluded that failure to lose weight on a self reported low calorie diet was due to intake substantially higher than reported, and not to a slow metabolism.
Two things about that study matter more than the headline. It was ten people, nine women and one man, selected because they said diets did not work for them, so the 47 percent is a figure for that group, not for everyone. And nobody in it was lying. They kept diaries in good faith and still missed nearly half, which is the honest reading of under reporting: it is a property of diaries, not of character. The larger OPEN study of 484 adults later found under reporting with both food frequency questionnaires and 24 hour recalls against the same biomarker, so the drift is general, just usually smaller.
The activity side has its own measured error. Shcherbina and colleagues at Stanford tested seven wrist devices against indirect calorimetry in 2017 and found none with an energy expenditure error under 20 percent; median errors ran from 27 percent on the best device to 93 percent on the worst. Heart rate was fine. Calories burned were, to use the technical term, a guess with a font. The NIDDK planner page itself says, as of 12 October 2026, that people often underestimate how much they eat.
What does the arithmetic say for a 500 kcal deficit?
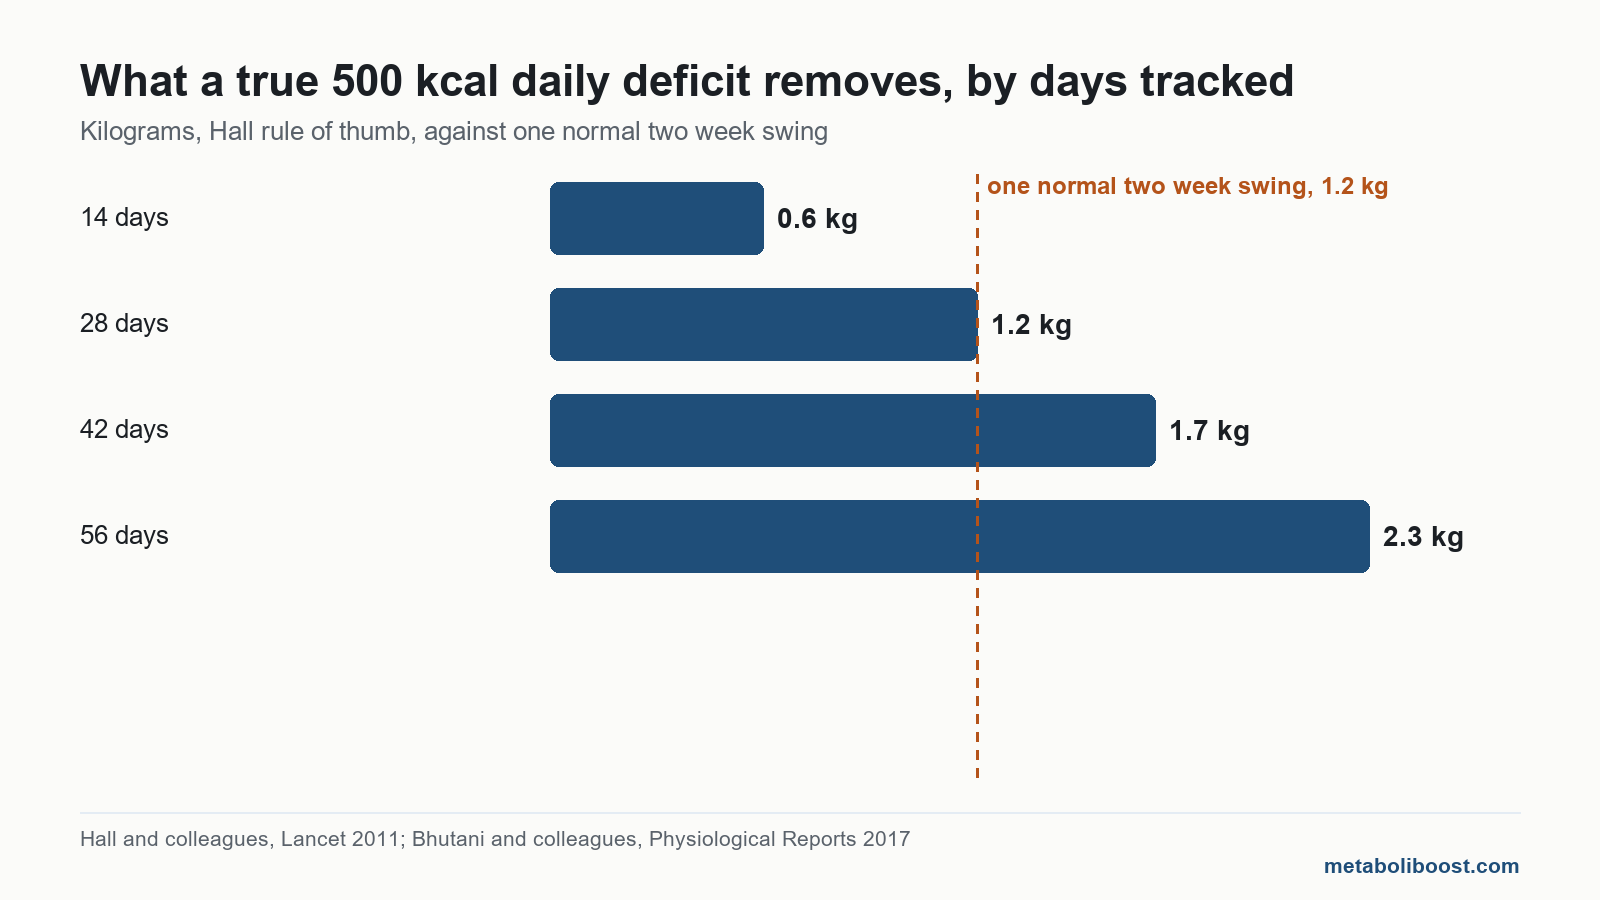
Here is the worked example, with the inputs shown so you can argue with them. Take a true deficit of 500 kcal a day, held every day including weekends. The 3,500 rule gives a straight line of 0.45 kg a week. The Hall rule gives an eventual 50 lb for a 500 kcal change with half at one year, which, approximated as a simple curve, starts nearer 0.3 kg a week. The real planner output sits between the two. Beside both sits the 1.2 kg two week swing from the Bhutani cohort.
| Days on a true 500 kcal daily deficit | Expected loss, 3,500 kcal per pound rule | Expected loss, Hall rule of thumb | One normal two week swing, Bhutani 2017 |
|---|---|---|---|
| 14 days | 0.9 kg | 0.6 kg | 1.2 kg either way |
| 28 days | 1.8 kg | 1.2 kg | 1.2 kg either way |
| 42 days | 2.7 kg | 1.7 kg | 1.2 kg either way |
| 56 days | 3.6 kg | 2.3 kg | 1.2 kg either way |
Read the table left to right and the problem is obvious. At 14 days the expected loss is smaller than one normal swing. At 28 days it is about the same size. Only around six to eight weeks does the expected loss clear two swings, which is roughly where a change becomes something you can trust rather than something you can hope. So a month of flat readings does not mean the deficit failed. It means a month is not yet long enough to tell, provided the deficit is real, and the previous section is about whether it is.
One caveat, stated plainly: both rules describe an average overweight adult, and Hall and colleagues note that people with more body fat lose more for the same change and take longer to settle. The numbers above are for seeing whether a reading is inside the noise, not for predicting what anyone will weigh on a date.

What do people who posted this actually report?
The forums are where this question actually lives, so I read four r/loseit threads from May to October 2026, about 380 comments in all, and paraphrased what the posters and the most upvoted replies said. This is testimony, not evidence: nobody in these threads was measured, and the replies are other members, not clinicians.
| Thread, r/loseit | What the poster reported | Where the replies landed |
|---|---|---|
| May 2026 | About a month at a logged 1,500 kcal, maintenance from a calculator at 1,900, lifting and creatine both started the same month, one or two restaurant meals a week | The top reply recomputed maintenance nearer 1,750, making the deficit about 250 kcal and the expected loss around a kilogram, inside water noise |
| June 2026 | A month of logging at roughly 1,520 kcal, two weigh ins a week apart, both the same | Two readings cannot show a trend; one commenter reported a 4 lb difference between morning and evening on the same day |
| September 2026 | A long explainer from a member reporting a 50 lb loss, listing untracked oil, drinks and cheat meals, tracker over counting and short spans | 856 upvotes; the dissent was about how much muscle changes resting burn, not about the list |
| October 2026 | Three weeks on prepacked meals, down 1.5 to 2 kg in week one, 300 g in week two, up 200 g in week three | Replies pointed out the net change was still 1.6 to 2.1 kg down and that hundreds of grams is noise |
The pattern across the four is tighter than I expected. Every poster had tracked for a month or less. In three of the four the arithmetic deficit, once a replier redid it, came out under 500 kcal, which puts the expected loss inside the noise band from the table above. Two had started lifting, creatine or both in the same month, and in the May thread the first reply raised water retention from both before anything else. The October poster had in fact lost about 2 kg over three weeks and read the last week’s 200 g rise as failure.
Where the accounts cut against the pattern: the September explainer insists that a true deficit always shows, and one commenter under the May thread reported a watch burn figure that matched their spreadsheet within about 100 kcal over a month, against the Stanford result. Both can be true. A true deficit does always show, eventually; the argument is only about when. And a device can suit one wrist and not another, which is what a 27 to 93 percent spread between devices means.
Deficit reality check: is the expected loss bigger than the noise yet?
Enter the maintenance figure you are using, the average daily intake your log shows and the number of days you have tracked. The tool works the arithmetic from this page with your numbers and sets it beside the 1.2 kg normal two week swing. It does not say why the scale has or has not moved, and it does not give a target.
Both rules describe an average overweight adult and both treat the maintenance figure as correct, which the Lichtman study suggests it often is not. This is arithmetic on your inputs, not a prediction, a target or a deficit to follow.
What moves the scale that is not fat?
Water, mostly, and it moves for reasons that have nothing to do with fat. Kreitzman and colleagues described glycogen as stored with three to four parts water, so the first week of a lower carbohydrate intake drops weight quickly and a birthday weekend puts it straight back. That is why the October poster lost 1.5 to 2 kg in week one and almost nothing after. Salt holds water too, and so does the recovery from a new training routine. Across the menstrual cycle the swing is commonly quoted at one to two kilograms; the accounts above put it in that range, and I could not confirm a single trial figure within this article’s budget, so treat it as reported rather than measured.
Then there is the week itself. Orsama and colleagues logged 4,657 daily weights from 80 adults in 2014 and found weight peaking on Sunday and Monday and falling through the week, most clearly in people who were losing or holding weight. Their conclusion was that weekend rises should be read as normal rather than as gain. If you weigh on Mondays, you are sampling your own high tide. The practical fix is dull and effective: weigh daily in the same conditions, average the week, and compare weekly averages. The water weight article goes through what each of these shifts looks like on its own.

None of this is the 24 hour metabolism from the infomercial, and it is not starvation mode either. The piece on losing slowly while eating less measures how small real adaptation is, and the plateau article handles what happens after months of loss. This page is about the person who has not started losing yet and wants to know whether the method is broken. Usually it is not. Usually the clock and the diary are.
When is it worth asking a doctor instead of the spreadsheet?
There is a point where the arithmetic stops being the right tool. If the weekly average has not moved after eight weeks of logging that includes oils, drinks and weekends, weighed rather than estimated, that is a result worth taking to a GP rather than solving by eating less again. Thyroid function, some medicines, polycystic ovary syndrome and other conditions change the energy side of the equation, and they are diagnosed by tests, not by a forum or by this article. The PCOS page covers why the usual advice underdelivers there.
Equally, if the effort to hold a deficit has turned into skipping meals, fear of the scale or eating well under what any calculator suggests, that is a reason to talk to a professional now, not after another month of data. Nothing in this article is a reason to eat less than you are, and no table here is a target.
Frequently asked questions
Can you be in a calorie deficit and gain weight on the scale?
Yes, for a short span. In the Bhutani 2017 cohort the two week change in adults eating at maintenance had a standard deviation of 1.2 kg, so a rise of a kilogram over a fortnight is inside normal noise even with a real deficit underneath it. Over eight weeks a true deficit shows through.
How long should a deficit run before deciding it is not working?
On the arithmetic in this article, a 500 kcal deficit clears two normal swings at roughly six to eight weeks. A weekly average that has not moved after eight weeks of weighed logging is a result worth acting on; two weeks is not.
Does a food scale really change the numbers that much?
The Lichtman study found a 47 percent gap between diaries and measured intake, and the replies in every thread read named oil, drinks, sauces and restaurant meals as the usual missing items. Weighing portions closes most of that gap. It does not make anyone a better person; it makes the diary a better instrument.
Should the calories a watch says I burned be eaten back?
Treat them as an estimate with a known error. The Stanford comparison found no wrist device under 20 percent error on energy expenditure, and several above 50 percent. Many people in the threads tracked expenditure as sedentary and ignored the device’s figure, which removes the largest single error from the calculation.
Is a smaller deficit a bad idea if the scale is flat?
Not in itself; a smaller deficit simply takes longer to clear the noise. A 250 kcal deficit removes about half of what the table shows for 500, so the point where it shows reliably moves out to three or four months. The mistake is reading the flat weeks as proof and cutting further.
Why did the first week go well and then stop?
Glycogen is stored with three to four parts water, so a lower carbohydrate intake drops water weight quickly in the first days. After that, the scale shows fat loss at its real pace, which is slower and buried in the daily swing. The early drop was real weight, it just was not fat.
Finished the page? The same five questions from the top, to see what stuck.
This article is general information, not medical advice, and is not a substitute for care from a qualified healthcare professional. Speak to your doctor about your own situation.
Leave a Reply