
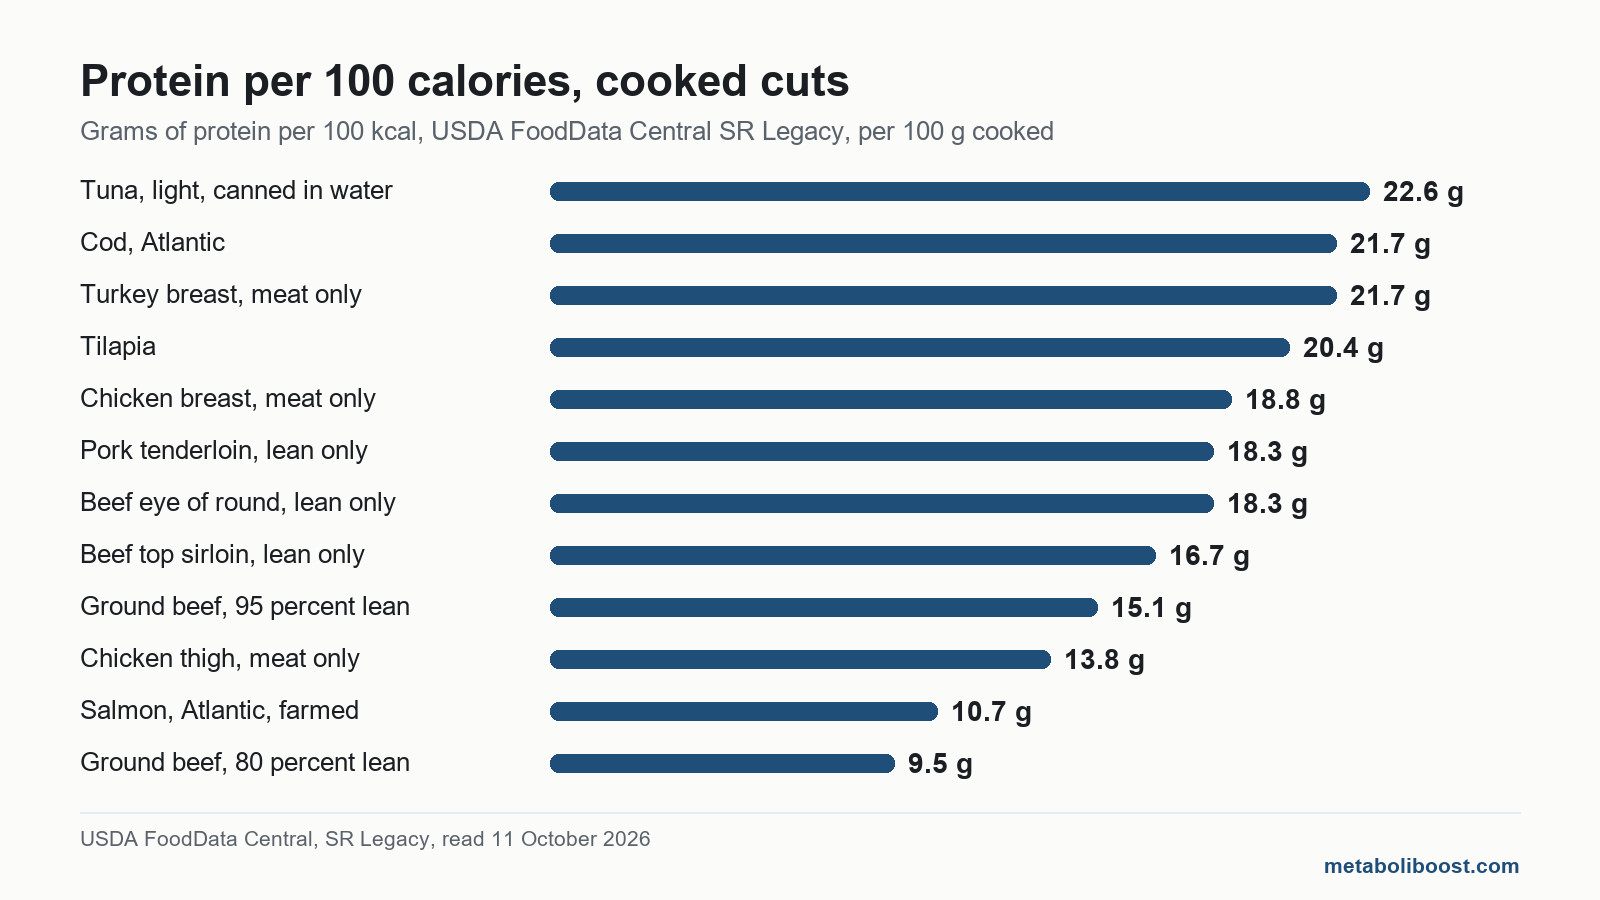
The best lean meats for weight loss are the ones that deliver the most protein for the calories, and on that measure the winners are not the ones the listicles lead with. From USDA data for 18 cooked cuts: canned tuna, cod and turkey breast top 21 grams of protein per 100 calories, chicken breast gives 18.8, and skinless chicken thigh only 13.8.
Listen to this article, about 18 minutes. A synthetic voice reads the article and announces each section title as it begins; tables are read row by row and the questions at the end are left out.
Recorded 11 October 2026 from the article as published that day. Press a chapter to jump there; the highlighted line is what is playing. A play button sits beside every section heading, and once you scroll past this player a bar at the bottom of the screen keeps the controls in reach. Tap or click any sentence to hear the reading start from there.
On this page: a USDA table of 18 cooked cuts ranked by grams of protein per 100 calories, the lean and extra lean rule quoted from the federal labelling regulation, Indian fish and paneer rows from the national food tables, and what four r/loseit threads report.
Think you already know this? Five questions, one minute.
Every answer is on this page. Answer from what you know now; the page fills in the rest.
-
1. Under the US meat labelling rule, what must a product contain per 100 g to be called extra lean?
The rule at 9 CFR 317.362(e) sets extra lean at less than 5 g of fat, less than 2 g of saturated fat and less than 95 mg of cholesterol per 100 g; plain lean allows up to 10 g of fat and 4.5 g of saturated fat with the same cholesterol limit. Read the section
-
2. Which of these cooked foods gives the most protein per 100 calories in the USDA data?
USDA FoodData Central lists cooked Atlantic cod at 22.8 g of protein and 105 kcal per 100 g, which is 21.7 g per 100 kcal, against 18.8 for roasted chicken breast and 13.8 for skinless thigh. Read the section
-
3. How does protein per 100 kcal compare between raw and roasted skinless chicken breast?
USDA FoodData Central has raw breast at 22.5 g protein and 120 kcal and roasted breast at 31.0 g and 165 kcal per 100 g; both divide to 18.8 g per 100 kcal, so only the per 100 g figures move with cooking. Read the section
-
4. Which of these qualifies as extra lean when the label rule is applied to the USDA cooked figures?
USDA FoodData Central lists roasted lean pork tenderloin at 3.5 g fat, 1.2 g saturated fat and 73 mg cholesterol per 100 g, inside the extra lean limits of 9 CFR 317.362; skinless thigh fails on cholesterol at 133 mg and cooked 93 percent lean turkey fails on fat at 11.6 g. Read the section
-
5. What share of the calories in protein does the body spend digesting and storing it, according to the published ranges?
The review in Nutrition and Metabolism reports diet induced thermogenesis of 20 to 30 percent for protein, 5 to 10 percent for carbohydrate and 0 to 3 percent for fat, with the whole mixed diet effect at 5 to 15 percent of daily energy expenditure. Read the section
That number, grams of protein per 100 calories, is the whole article in one column, and it is the column none of the pages ranking for this search bother to compute. They list cuts, quote protein per three ounces, and leave you to do the division in the supermarket aisle. This page does the division, quotes the rule that decides what may legally be called lean, and reports what people who ate this way say happened. Not a single pound is promised anywhere below, which on this topic counts as a feature.
What does lean actually mean on a meat label?
In the United States it is a legal term with numbers attached, which is more than can be said for “clean”, “natural” or “high protein”. The federal meat labelling rule, 9 CFR 317.362(e), says the term lean may be used provided the product “contains less than 10 g of fat, 4.5 g or less of saturated fat, and less than 95 mg of cholesterol per 100 g of product and per reference amount customarily consumed”. Extra lean is the same sentence with tighter numbers: “less than 5 g of fat, less than 2 g of saturated fat, and less than 95 mg of cholesterol per 100 g”.
Two things follow that the ranking pages miss. First, the rule is written per 100 grams, so a cut either qualifies or it does not, however small a portion you pretend to eat. Second, cholesterol is in the test. That is why skinless chicken thigh and drumstick fail in the table below: their fat is under 10 g, but roasted dark chicken meat carries 130 mg of cholesterol per 100 g, and the rule stops at 95. “93 percent lean” ground turkey is a different trick again, and it gets its own paragraph further down.
Which cuts give the most protein per 100 calories?
Every row below is a cooked food from the USDA’s FoodData Central SR Legacy dataset, downloaded whole on 11 October 2026 and read per 100 grams; the cut name is shortened but the link goes to the exact USDA record. Protein per 100 kcal is protein divided by calories, times 100. The last column applies the label rule quoted above to the USDA figures; that application is mine, not the USDA’s, and uses the per 100 g test only.
Read the column in bold from the top. Lean white fish and canned tuna sit above every land animal, turkey breast is level with cod, and chicken breast, the default lean meat of every meal plan on earth, is sixth. Pork tenderloin and eye of round beef are within half a gram of it. Then there is a long slide: skinless thigh gives a third less protein per calorie than breast, and chicken thigh with the skin on gives about the same as farmed salmon, which at least brings its omega 3 fats to the table in exchange.
Bacon is in the table for honesty. At 35.7 g of protein per 100 g it is, by weight, the highest protein food on the list, which is exactly the number a packet will show you. Per 100 calories it is the lowest. Both figures are true. Only one of them is useful.
Does weighing meat raw or cooked change the answer?
It changes the per 100 g figures a great deal and the per 100 kcal figure almost not at all, which is the quiet reason the ratio is the right thing to compare. USDA lists raw skinless chicken breast at 22.5 g of protein and 120 kcal per 100 g, and the same cut roasted at 31.0 g and 165 kcal. Divide each: 22.5 over 120 is 18.8 grams per 100 kcal, and 31.0 over 165 is also 18.8. Cooking drives off water, so the protein and the calories concentrate together.
The same records show the other thing a label will not tell you. USDA carries a separate entry for raw chicken breast with added solution, the brine that pre seasoned and “enhanced” poultry is injected with. Its protein drops from 22.5 to 20.3 g per 100 g, because some of what you are weighing is water, and its sodium nearly quadruples, from 45 to 173 mg. Turkey breast tells the same story: with added solution it carries 184 mg of sodium per 100 g against 114 mg plain. Neither number is dangerous on its own. Both explain a pattern in the forum accounts below.
Is white meat always leaner than red meat?
No, and the table already said so. Pork tenderloin and beef eye of round, red meat by any kitchen definition, qualify as extra lean under the federal rule and give more protein per calorie than any part of a chicken except the breast. Skinless chicken thigh, white meat by the shopping aisle definition, qualifies as neither. The colour tells you about the animal’s muscle, not about the cut’s fat. Our piece on what the high protein trials actually found makes the same point from the other direction: the studies set protein targets, not meat colours.
“93 percent lean” ground turkey is the label that most needs this paragraph. The percentage is fat by raw weight, and seven percent by weight in a food that is mostly water is a lot of fat by calories. Once the water cooks off, the USDA record for the cooked crumbles shows 11.6 g of fat per 100 g, which fails the lean test, and 12.7 g of protein per 100 kcal, below skinless chicken thigh.
For readers in India, here is the same arithmetic from the Indian Food Composition Tables 2017 published by the National Institute of Nutrition, which reports raw foods with energy in kilojoules; I have divided by 4.184 for kcal. Because the ratio barely moves with cooking, these rows can be read beside the USDA table.
| Food, raw, as IFCT 2017 names it | kcal per 100 g | Protein g per 100 g | Fat g per 100 g | Protein g per 100 kcal |
|---|---|---|---|---|
| Prawns, big (Macrobrachium rosenbergii) | 91 | 19.2 | 0.5 | 21.2 |
| Rohu (Labeo rohita) | 102 | 19.7 | 2.4 | 19.3 |
| Catla (Catla catla) | 94 | 17.9 | 2.2 | 19.0 |
| Chicken, poultry, breast, skinless | 168 | 21.8 | 9.0 | 13.0 |
| Egg, poultry, whole, boiled | 148 | 13.4 | 10.5 | 9.1 |
| Paneer | 305 | 18.9 | 24.8 | 6.2 |
Rohu and catla sit with cod and tilapia, and big freshwater prawns sit at the top. Paneer, which half the vegetarian meal plans in the country treat as the protein, gives 6.2 g per 100 kcal, about the same as bacon, because a quarter of its weight is fat. That is not an argument against paneer, only against calling it lean. One honest disagreement between the tables: the Indian survey measured skinless chicken breast at 9.0 g of fat per 100 g raw, while USDA has 2.6 g. Different birds, different trimming, different labs; both figures stay in.
Swap calculator: the same portion, a leaner cut
Pick the cut you eat now, the cooked portion in grams, and a cut you are considering. It shows the protein and calories of each from the USDA table above. It sets no target and says nothing about weight; it is the table’s arithmetic for your portion.
Figures are USDA FoodData Central SR Legacy values per 100 g cooked, read 11 October 2026, scaled to your portion. Pre seasoned or brined meat carries more water and sodium than these rows. Works in your browser; nothing is stored or sent.
Does protein from lean meat speed up your metabolism?
A little, in a way that is real, measurable and nowhere near what the fat burner adverts imply. The body spends energy digesting and storing food, and the fraction differs by nutrient. A review in Nutrition and Metabolism reports the published ranges as 0 to 3 percent of the calories for fat, 5 to 10 percent for carbohydrate and 20 to 30 percent for protein, and puts the whole effect of a mixed diet at 5 to 15 percent of daily energy expenditure. So of 100 kcal of chicken breast protein, roughly 20 to 30 kcal goes on processing it. That is the entire “protein burns fat” phenomenon: a chicken breast burns nothing, it just costs a bit more to process than bread.
The larger effect, and the one the trials hang their results on, is appetite. A review in the American Journal of Clinical Nutrition found that higher protein meals increase perceived fullness and satiety hormones in acute feeding trials, but did not show a reliable effect on how much people ate at the next meal. Short, tightly controlled trials of higher protein diets did better than lower protein ones; longer trials were less consistent, and the authors put most of that down to whether people kept to the diet. Lean meat helps the people it helps by making a deficit easier to live with, not by changing its arithmetic, which is the point our guide to what a day of food adds up to keeps coming back to.
What do people who switched to lean meats actually report?
Forum threads are testimony, not evidence, and nothing in this section is a finding. I read four public threads on the r/loseit forum, dated November 2025 to July 2026, and about 150 comments across them. The accounts split in a way the trial literature would predict.
The most common report is the one in a July 2026 thread that opened by asking who had tried high protein and failed. The original poster described moving from around 70 g of protein a day to about 120 g and said the difference in hunger was night and day. But the thread had asked for failures and it got them: one poster said protein never kept them full, another said two weeks of it ended in a bread craving, a third felt bloated and heavy on a lean meat heavy pattern. Several said fibre, not protein, was what kept them full. A March 2026 thread asking why high protein feels easier drew about 60 replies, nearly all landing on the word fullness, with one dissenter arguing that protein does not slow stomach emptying as much as people assume.

The practical reports are the useful ones. In a February 2026 thread, a poster on a deficit swapped in pre seasoned chicken breast from the supermarket and watched the scale jump by several pounds in days. The replies pointed to sodium; the poster checked their log and found it past 4,000 mg. The same thread became a tutorial on weighing meat raw against cooked, and one reply gave the method that avoids the conversion: weigh the whole raw pack, cook it, log the fraction you eat. That is the added solution row of the USDA table, met in a kitchen.
The account that cut hardest against the pattern was in a November 2025 thread from someone proposing to eat nothing but lean protein and vegetables with no added fat. Most of the 40 replies told them to add fat and some carbohydrate, and one described doing a version of this for months and becoming seriously unwell. That is one person’s account and proves nothing about anyone else. An eating pattern that strips out whole nutrient groups is a conversation for a doctor or a registered dietitian, not a forum and not this page.
Where the accounts agree with the research: fullness is the mechanism, real for many and absent for some, which is what the review above found. Where they add to it: nobody in the trials was buying brined fajita chicken, and sodium and the raw versus cooked muddle are the two mistakes that make a sensible plan look like it is failing. For how much protein is worth aiming at in the first place, our piece on how much protein you actually need walks through the published figures.
Frequently asked questions
Is chicken breast the leanest meat?
No. By protein per 100 calories, canned light tuna, cod, turkey breast and tilapia all beat roasted chicken breast in the USDA data, and pork tenderloin and beef eye of round are within half a gram of it. Chicken breast is a good choice. It is not the only one, and it is not the top.
Is skinless chicken thigh a lean meat?
Not under the US labelling rule. Roasted skinless thigh has 8.2 g of fat per 100 g, under the 10 g limit, but 133 mg of cholesterol, above the 95 mg limit, so it qualifies as neither lean nor extra lean. It also gives about a third less protein per calorie than breast.
Does ground turkey labelled 93 percent lean count as lean?
The percentage is fat by raw weight, not by calories. The USDA record for the cooked crumbles shows 11.6 g of fat per 100 g, which fails the lean test, and 12.7 g of protein per 100 kcal, less than skinless chicken thigh. A lean percentage on the pack is not the same as a lean food on the plate.
Should I weigh meat raw or cooked when counting calories?
Either, as long as you log the matching USDA entry. Raw chicken breast is 120 kcal per 100 g and roasted is 165, so weighing cooked meat against a raw entry undercounts. The method several forum users recommend is to weigh the whole raw pack, cook it, and log the fraction you eat.
Is fish better than meat for weight loss?
Lean white fish gives more protein per calorie than any land meat in the table: cod 21.7 g per 100 kcal, tilapia 20.4, rohu 19.3. Oily fish such as farmed salmon gives about half that because of its fat, which brings omega 3 fats the lean cuts lack. Neither is better for weight loss on its own; the deficit is what matters, and the fish only changes how easy it is to keep.
Is paneer a lean protein?
No. The Indian Food Composition Tables 2017 list paneer at 18.9 g of protein and 24.8 g of fat per 100 g, which works out at 6.2 g of protein per 100 kcal, about the same as bacon. It is a perfectly good food and a poor fit for the word lean. Rohu, catla and prawns give three times the protein per calorie.
Finished the page? The same five questions from the top, to see what stuck.
This article is general information, not medical advice, and is not a substitute for care from a qualified healthcare professional. Speak to your doctor about your own situation.
Leave a Reply