
Metabolic age is not a reading of how old your body is. A scale estimates your resting calorie burn, then reports whichever chronological age has that burn on average. It mostly tracks your muscle, your body size and your actual age, which makes it a rough progress marker rather than a verdict on your health.
What is metabolic age actually measuring?
Step on a body composition scale and it pushes a small current through you. Fat resists that current more than lean tissue does, so from the resistance the machine estimates how much of you is lean mass. It uses that estimate to calculate a basal metabolic rate, and then it does the part nobody puts on the box: it looks up which age group burns roughly that many calories at rest, and prints that age on the display.
So the number is a translation, not a measurement. Nothing in there has inspected a cell, a chromosome or a hormone. It has seen a body composition estimate, and dressed it in the language of ageing, which is admittedly a better hook than “your estimated resting burn is broadly typical for your height”.
- 📌 A metabolic age below your real age → your estimated resting burn is above average for people your age, usually because you carry more lean mass than the average person in that group.
- 📌 A metabolic age above your real age → the reverse. That is information about your body composition, and it is not a diagnosis of anything.
Why do two people the same age get different numbers?
Because tissue is not interchangeable. In the reference values used to model resting energy expenditure, skeletal muscle burns roughly 13 kcal per kg per day at rest while fat tissue burns roughly 4.5. Muscle really is the more expensive tissue to own.
That gap is real, and far smaller than gym folklore claims. A kilogram of muscle is worth around nine extra calories a day, not the several hundred you may have been promised. The organs are where the energy actually goes: liver, brain, heart and kidneys are about 5 to 6 percent of body mass and account for roughly 60 percent of resting energy expenditure, and nobody has yet found a way to train a liver. The same arithmetic, and the measured size of every other lever, is set out in our guide to raising BMR honestly.
Which leaves body size doing most of the heavy lifting. Bigger bodies burn more at rest, and men typically burn more than women of the same weight because they carry more lean mass. Push all of that through a lookup table of age averages and quite ordinary differences in build come back out as dramatic differences in “age”.
| Real age | Metabolic age | |
|---|---|---|
| What it is | Time since you were born | An estimated resting calorie burn, expressed as the age with that average burn |
| How it is obtained | A calendar | A body composition estimate → a BMR formula → an age lookup table |
| Same answer on every device | Yes | No. Formulas are proprietary and differ between manufacturers |
| Can it move | In one direction, at one speed | Up or down, as your muscle and fat mass change |
| What it is good for | Birthdays and reference ranges | Watching one trend on one machine over months |
| What it cannot do | Change | Diagnose anything, or predict how long you will live |
How much can you trust the number on the display?
Treat it as a trend line rather than a test result. The formula that converts impedance into a metabolic age is proprietary and differs between manufacturers, so the same person can step off one machine at 26 and onto another at 34 with nothing changed except the arithmetic.
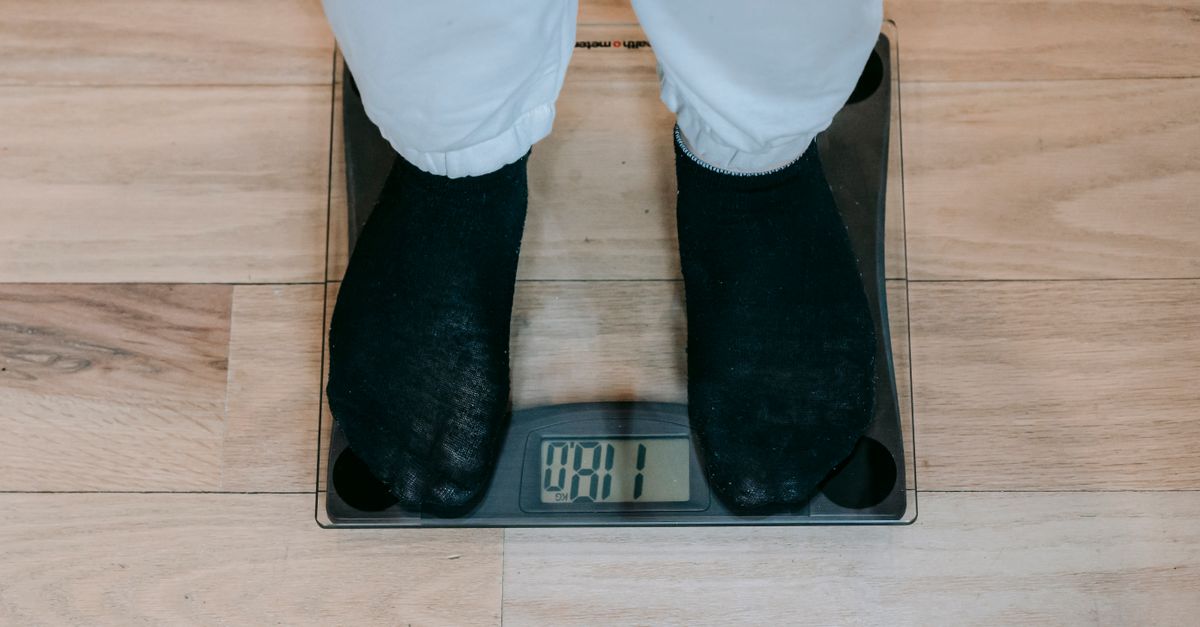
The impedance reading underneath is largely a measure of how much water you are carrying, which makes it easy to nudge.
⚠️ Things that move it without anything about you having changed:
- A large drink or full bladder in the last couple of hours
- A meal in the last few hours, especially a salty one
- Training earlier the same day, which flatters the reading
- A different machine, or the same machine after a firmware update
- Where you are in your menstrual cycle
It is not noise all the way down, though. In a study of 8,590 Spanish workers measured on a single bioimpedance device, an elevated metabolic age tracked closely with insulin resistance risk scores, with odds ratios above four for two of the three scores tested. A high reading is a fair prompt to have the real markers looked at. It is not itself a finding, and it cannot diagnose anything.
Does a younger metabolic age mean faster weight loss?
It helps at the margins, and it is not the lever the marketing implies. Between two people of similar size, differences in resting burn are usually modest, and what you eat and how much you move comfortably outweigh them.
Where the number earns its keep is in what happens after a long, aggressive diet. When 109 adults ate about 25 percent fewer calories for twelve months, resting metabolic rate fell by about 101 kcal a day. Roughly 60 of those calories were explained by the loss of tissue itself, and roughly 40 were a genuine metabolic adaptation on top of that.
That is why maintenance after a hard diet is harder than the calorie arithmetic predicts, and why a metabolic age reading can drift older during a diet that is otherwise going to plan, which is a uniquely deflating way to receive good news.
The adaptation is real and it is also finite. Around 40 kcal a day is a biscuit, not a sealed metabolic vault, and it does not make weight loss impossible. Anyone whose weight, energy or periods have changed in a way that worries them should speak to a doctor rather than to a scale.
What makes the number drift older?
- Losing lean mass, which tends to happen when weight comes off with no resistance training attached to it
- Gaining fat mass, which adds tissue that costs very little to keep
- Long stretches of severe restriction, for the adaptation reason above
- Sitting still most of the day, which changes the body composition that feeds the calculation
- Short sleep and sustained stress, mostly through appetite and how much you end up moving, rather than through any direct metabolic sorcery
Notice what is missing from that list. No food raises resting metabolic rate enough to register on a body composition scale. The thermic effects cited for green tea, chilli and cold water are measurable in a lab and worth a handful of calories, which is nowhere near enough to shift a number built on lean mass. As for the detox tea, the British Dietetic Association is unusually direct about the whole genre, and your liver was already doing the job for free. There is more on what genuinely slows things down in how to fix a slow metabolism naturally.
What actually moves it in the right direction?

Everything that builds or protects lean mass, and very little else. None of it is exciting, which is precisely why there is an industry selling alternatives.
- Resistance training, the only dependable way to add the tissue the formula rewards
- Enough protein across the day, which helps protect lean mass while you are eating less
- General daily movement, which barely touches resting burn but changes how much you can eat without gaining fat
- Sleep, because short sleep reliably makes appetite and follow through worse
- A deficit you can actually live with, rather than the steepest one you can briefly survive
The chain runs one way, and the marketing likes to reverse it. Habits change body composition. Body composition changes the estimate. The estimate changes nothing.
Fat mass falls 📉 → the printed age falls with it 📉 → and your reason to care about the printed age falls too 📉, because by then you already have the thing the number was only ever standing in for.
How do you take a reading that means anything?
- ✔ Same machine every time, because readings from different devices are not comparable
- ✔ First thing in the morning, before food or drink, after the bathroom
- ✔ Before training rather than after it
- ✔ Monthly rather than daily, because day to day changes are mostly water
Does metabolic age say anything about how long you will live?
There is no evidence that a bioimpedance metabolic age predicts lifespan, and it should not be read that way. It is a restatement of a body composition estimate. It is not the same thing as the biological age measures used in ageing research, which are built on markers such as DNA methylation and are not what a bathroom scale is doing.
For anyone concerned about their metabolic health, blood pressure, blood glucose, lipids and a conversation with a doctor carry far more information than any figure a scale can produce. The NHS guidance on losing weight covers the basics.
Metabolic age is a repackaging of things you could measure directly, and that does not make it worthless. One number on one machine, watched over months, is an easier habit than a spreadsheet, and it moves when the useful things move. It just deserves to be read as what it is.
This article is general information, not personal medical advice. Changes in weight, energy, periods or body composition can have causes that need proper assessment, so please speak to a qualified healthcare professional about your own situation.
What is a good metabolic age?
There is no clinical threshold, because metabolic age is not a clinical measure. A reading at or below your chronological age simply means your estimated resting burn is average or better for your age group, which usually reflects lean mass. The direction it moves over months on the same machine is more informative than the figure itself.
Why did my metabolic age go up after I lost weight?
Two ordinary reasons. A smaller body burns fewer calories at rest, so the estimate falls and the reported age rises even when the weight loss went well. And if some of the loss was lean mass, the estimate falls further. Resistance training and adequate protein are what usually blunt this.
Are smart scales accurate for metabolic age?
They are reasonably consistent with themselves and poorly comparable with each other. The impedance measurement is sensitive to hydration, recent meals and recent exercise, and each manufacturer uses its own undisclosed formula. Use one machine, under the same conditions, and read the trend rather than the number.
Can you lower your metabolic age quickly?
Not honestly. The reading follows body composition, and lean mass is added slowly. A reading can drop within days from hydration alone, which is not the same as anything having changed. Real movement in the trend takes months of consistent training and eating.
Is metabolic age the same as biological age?
No. Biological age in research refers to markers of cellular ageing such as DNA methylation patterns, measured in a laboratory. Metabolic age from a scale is an estimated resting calorie burn converted into an age. They share a word and very little else.
Does a slow metabolism make weight loss impossible?
No. Differences in resting burn between people of similar size are usually modest, and the adaptation seen after prolonged dieting is measured in tens of calories a day rather than hundreds. If weight will not shift despite consistent effort, that is worth raising with a doctor, since thyroid and other conditions can be tested for.
Leave a Reply